
Climbing the Landfill
Garbage on the way UP. These are the GPK cards with genuine upward momentum right now — ranked purely from real recorded sales (never estimates): net 30-day and 90-day price moves plus how fast copies are actually changing hands. 628 cards had enough sales to be measured; these 9 are climbing hardest. Includes sales reported through 2026-08-24 (PSA reports sales ~2 days behind); rankings refresh hourly.
| # | Card | Value | 30d | 90d | Velocity | Why it's climbing |
|---|---|---|---|---|---|---|
| 1 |
 Adam Bomb Black Garba #26
2025 Worst Of Garbage Pail Kids 40th Anniversary · PSA 10 |
$157 | — | ▲ 88.2% | 4 sales/30d | Up 88% over 90d. 90 sales logged over the trailing 365 days. |
| 2 |
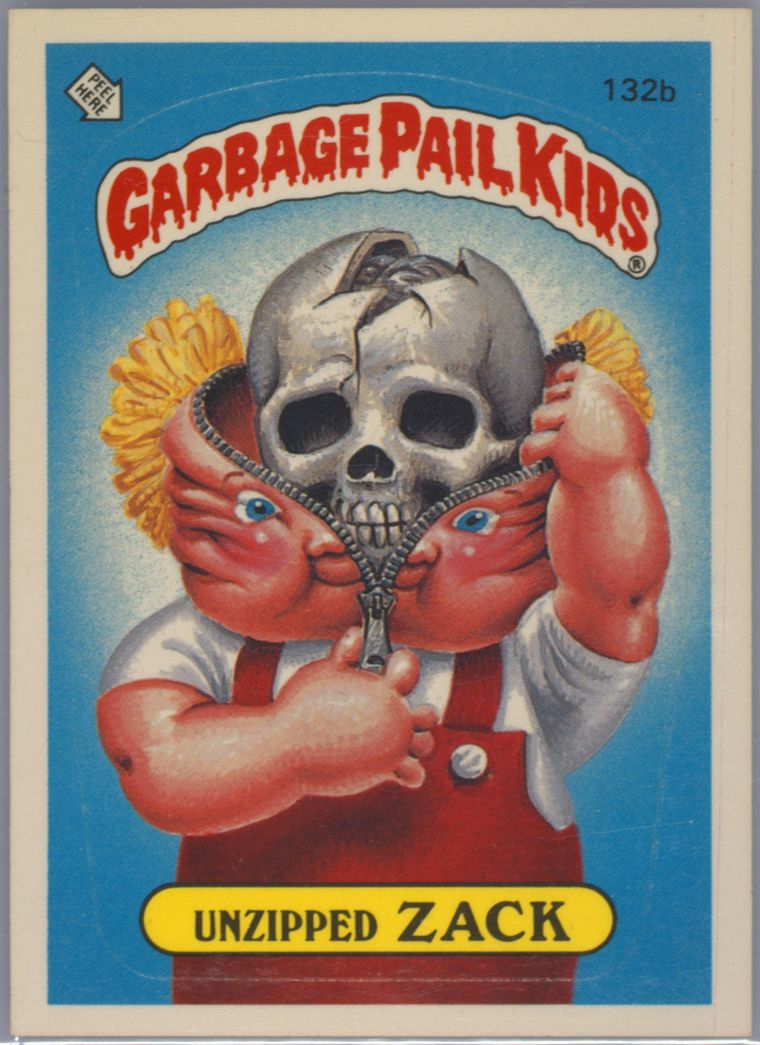 Unzipped Zack #132b
1986 Garbage Pail Kids Stickers · PSA 9 |
$36 | — | ▲ 48.1% | 0 sales/30d | Up 48% over 90d. 24 sales logged over the trailing 365 days. |
| 3 |
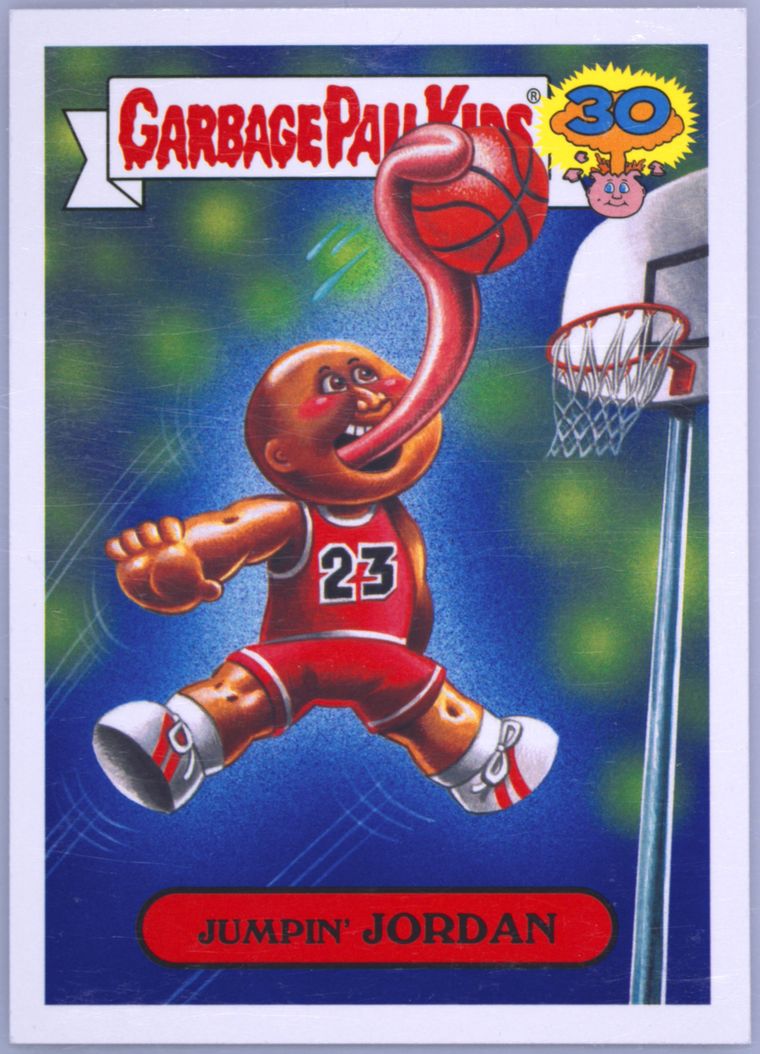 Jumpin' Jordan #7b
2015 Topps Garbage Pail Kids 30Th Anniversary '80'S Spoof · PSA 10 |
$397 | — | ▲ 32.7% | 0 sales/30d | Up 33% over 90d. 34 sales logged over the trailing 365 days. |
| 4 |
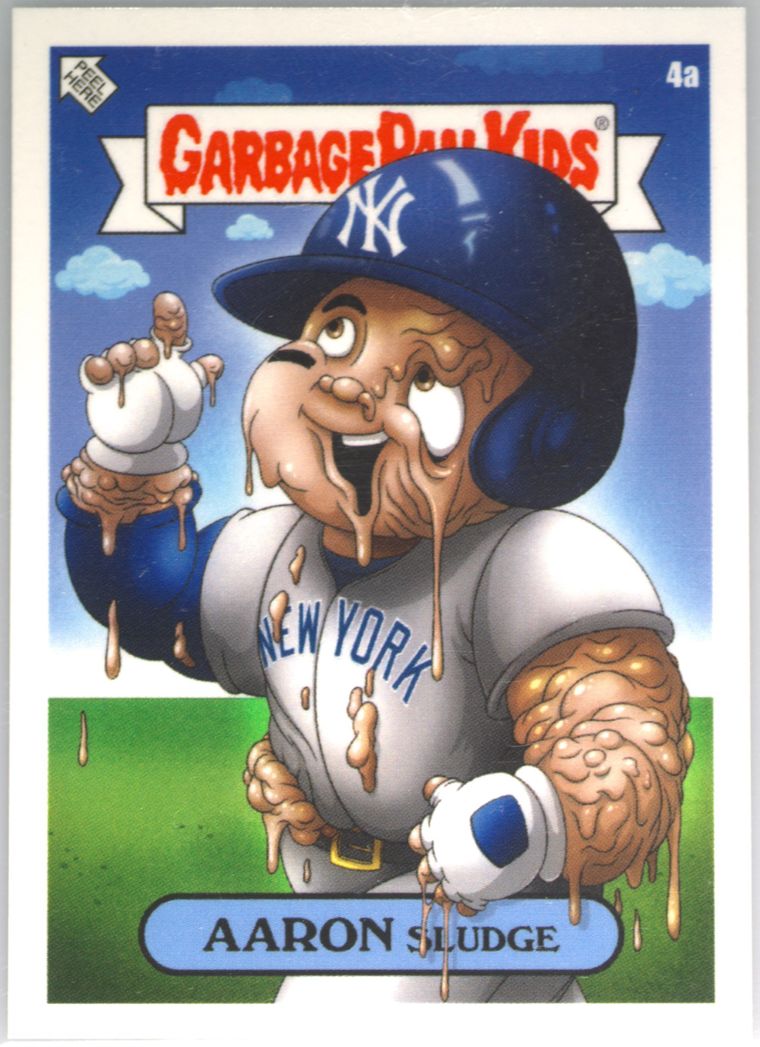 Aaron Sludge #4a
2022 Topps Garbage Pail Kids GPK X MLB Series 2 Alex Pardee · PSA 10 |
$116 | ▲ 20.7% | ▲ 21.2% | 2 sales/30d | Up 21% over 90d. 24 sales logged over the trailing 365 days. |
| 5 |
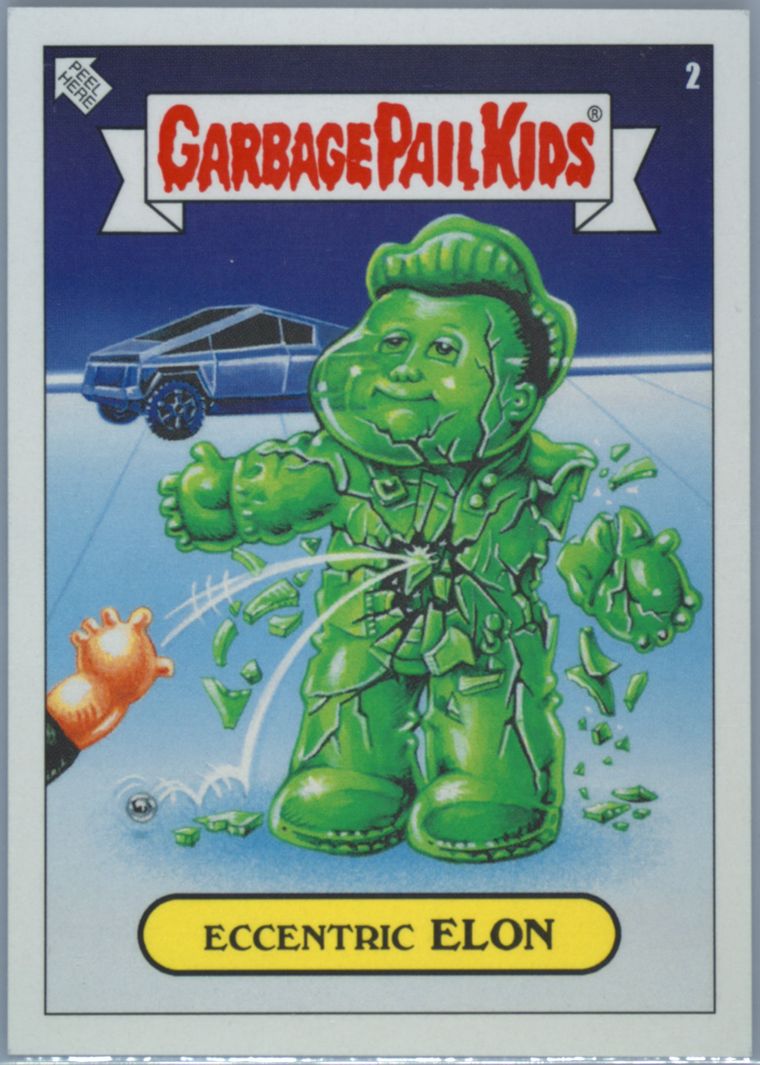 Eccentric Elon #2
2019 Garbage Pail Kids 2019 Was The Worst · PSA 10 |
$562 | ▲ 4.8% | ▲ 18.1% | 2 sales/30d | Up 18% over 90d. 15 sales logged over the trailing 365 days. |
| 6 |
 James Wood, Giant James #bgp-49
2025 Bowman Chrome Bowman Garbage Pail Kids · PSA 9 |
$200 | — | ▲ 8.3% | 1 sale/30d | Up 8% over 90d. 6 sales logged over the trailing 365 days. |
| 7 |
Garbage Pyro Kids Black Wac #7 2025 Worst Of Garbage Pail Kids 40th Anniversary · PSA 10 |
$504 | — | ▲ 18.0% | 1 sale/30d | Up 18% over 90d. 67 sales logged over the trailing 365 days. |
| 8 |
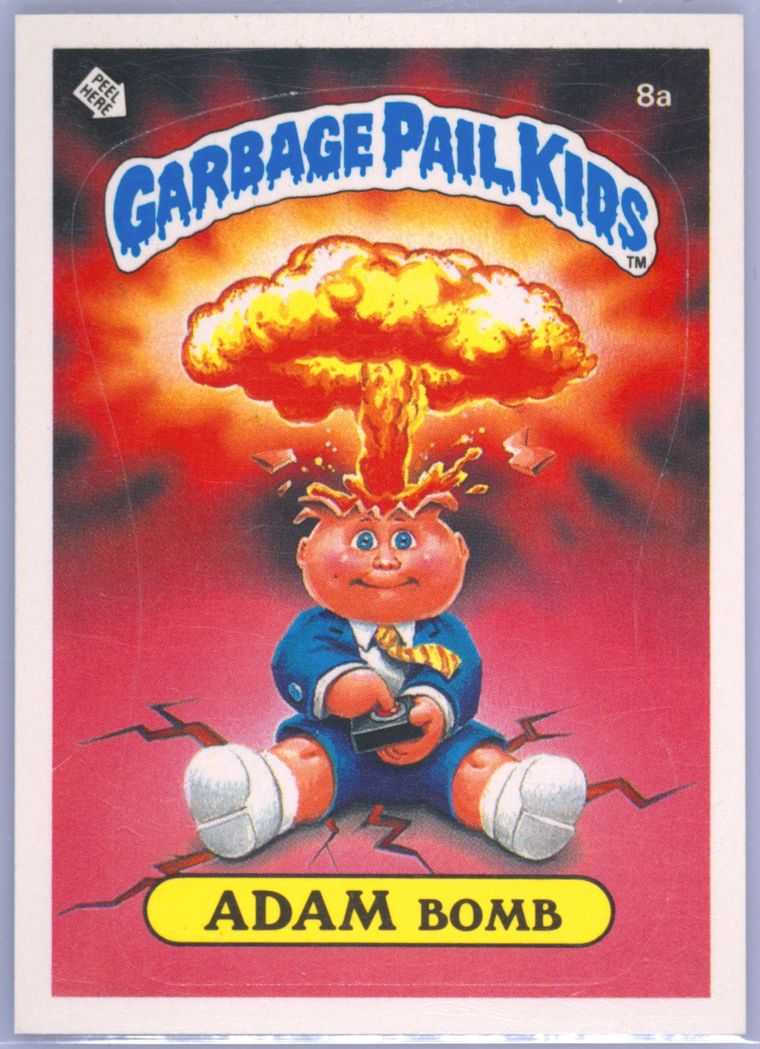 Adam Bomb #8a
1985 Garbage Pail Kids Original Series 1 · PSA 8 |
$734 | — | ▲ 14.5% | 0 sales/30d | Up 14% over 90d. 18 sales logged over the trailing 365 days. |
| 9 |
 Adam Bomb Black Garba #25
2025 Worst Of Garbage Pail Kids 40th Anniversary · PSA 10 |
$43 | ▲ 14.3% | — | 3 sales/30d | Median sale up 14% in 30d. 31 sales logged over the trailing 365 days. |
Climbing ranks each card's own window-median move (30d vs prior 60d, 90d vs prior 90d; both windows need 3+ sales) — a window-median engine, distinct from the repeat-sales trend tiles above.
How this board works
Every number here comes from real recorded sales of each exact card and grade — never from our value estimates and never from modeled prices. A card must have at least 6 recorded sales in the past year to qualify, so thinly-traded cards can't fake a trend with one lucky auction. The 30-day trend compares the median sale price of the last 30 days against the median of the 60 days before that; the 90-day trend compares the last 90 days against the prior 90. Both are net window-vs-window moves, so a card that just bounces up and down doesn't register as a climber. Velocity compares sales volume in the last 30 days to the card's own average 30-day pace over the preceding 90 days — cards selling faster than their norm get a boost, because rising prices on rising volume is the strongest kind of climb. The final rank blends the two price trends (30-day weighted heavier) plus the volume bonus. Cards whose last 30 days contradict the climb are dropped.
Momentum is a description of what just happened, not a promise of what happens next. Past climbs don't guarantee future climbs. This is automated market analysis for entertainment and research — not financial advice.